An Introduction to Cloud Native Monitoring Tools and Their Role in Modern Infrastructure
As organizations rush to modernize their IT environments, there is a growing trend of adopting cloud-native architectures to achieve flexibility, scalability, and resilience. However, this shift comes with a new set of challenges, the main one being how to monitor these dynamic and distributed systems effectively.
This post will provide a professional overview of cloud native monitoring tools and their significance. We'll also highlight the leading platforms shaping the future of modern infrastructure.
What is Cloud Monitoring?
Cloud monitoring is the process of continuously observing, tracking, and analyzing the performance, availability, and security of cloud-based infrastructure, applications, and services. This involves collecting metrics, logs, and traces from cloud resources to ensure that systems are running efficiently and securely.
Effective cloud monitoring enables organizations to:
- Detect and resolve issues quickly
- Maintain compliance and security
- Optimize resource usage and costs
- Deliver a reliable user experience
What is a Cloud Native Tool?
Cloud monitoring is performed using cloud native tools or software solutions designed specifically for cloud-native environments. Cloud native refers to applications and systems that are designed to fully use the flexibility, automation, and scalability of cloud computing. These tools are optimized for environments that use containers, microservices, and dynamic orchestration platforms.
Cloud-native tools have some useful key features for businesses, which include the following:
- Automated deployment and management
- Integration with orchestration platforms
- Support for containerized workloads
- Scalability to handle dynamic infrastructure
- Observability features for metrics, logs, and traces
Their Role in Modern Infrastructure
Modern infrastructure is characterized by distributed systems, frequent changes, and fast deployment cycles. Cloud native monitoring tools are essential for adopting modern development practices and maximizing the benefits of cloud infrastructure. Their primary roles include:
- Security and Compliance: Monitoring for anomalies and ensuring adherence to policies.
- Automation: Enabled automated detection, diagnosis, and remediation of issues.
- Visibility: Providing real-time insights into the health and performance of distributed applications and infrastructure.
- Scalability: Supporting environments that scale up or down quickly, based on demand.
- Cost Optimization: Tracking resource usage to identify inefficiencies and control expenses.
Leading Cloud Native Monitoring Tools
Businesses can monitor their cloud operations using a whole range of native and third-party tools. They can use a combination of cloud native tools or a single tool, depending on the business’s cloud environment.
Below are some of the most widely used cloud native monitoring tools.
Microtica
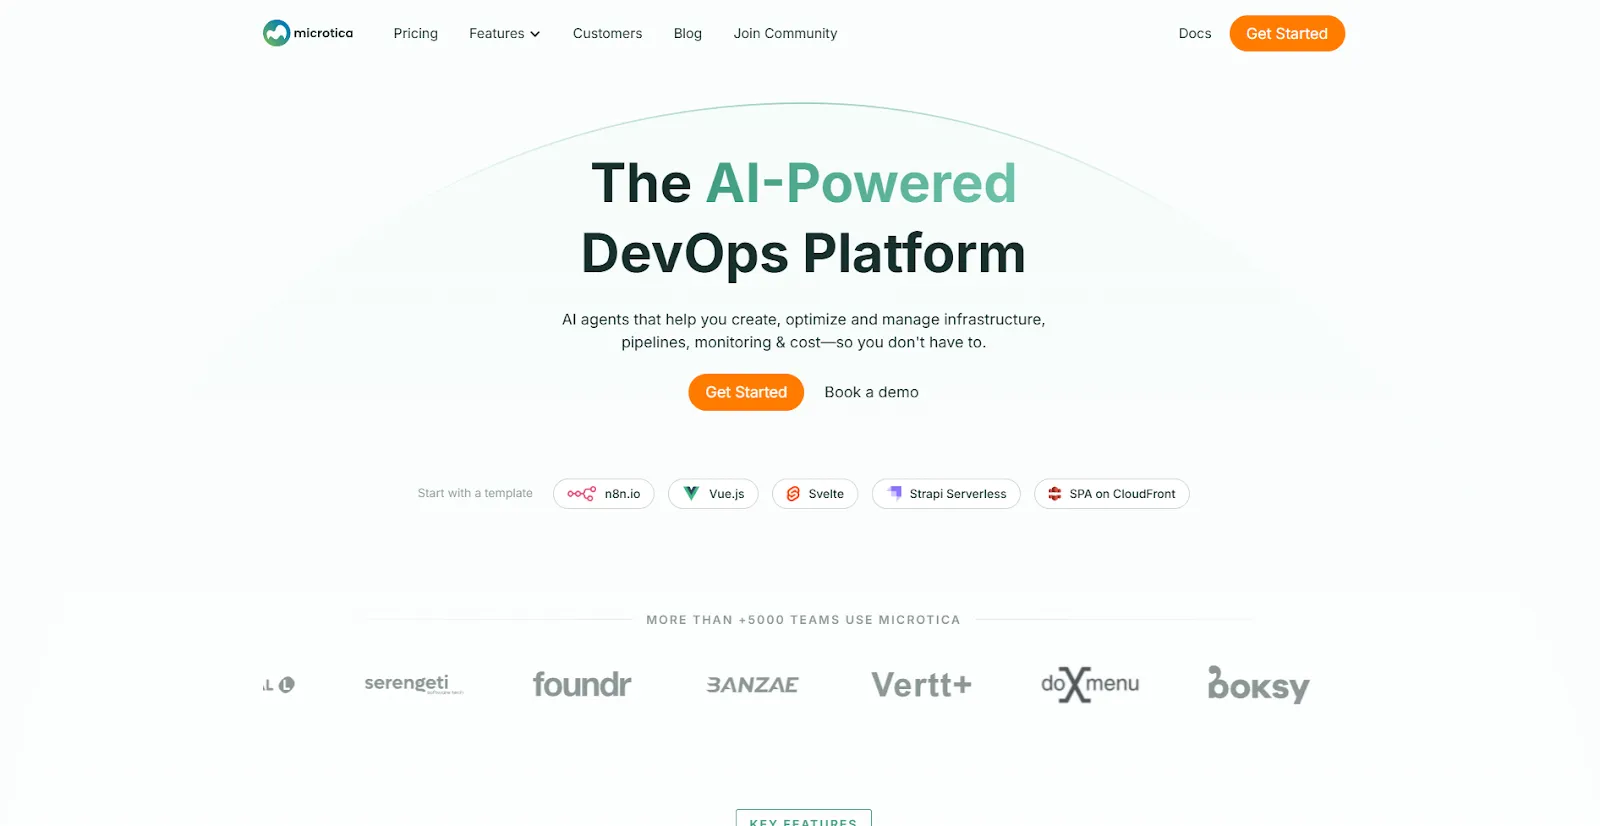
Microtica is an AI-powered DevOps platform that automates infrastructure provisioning, deployment, and monitoring for cloud environments. Its monitoring features are designed for real-time performance tracking, AI-assisted root cause analysis, and proactive remediation.
This is a platform that's suitable for startups, scaling businesses, DevOps teams, and enterprises. Its integrated approach helps organizations maintain stability, security, and cost efficiency.
The key capabilities of Microtica are:
- AI-driven diagnostics and automated remediation
- Real-time monitoring and tracking
- AI Infrastructure as code builder
- Cost breakdowns and optimization recommendations
- Support for AWS, GCP, and Azure
Prometheus
This is an open-source monitoring and altering toolkit designed for reliability and scalability in cloud-native environments. It's a widely adopted tool for Kubernetes monitoring. It's considered a comprehensive solution because it uses metrics to generate insights in easy-to-deploy packages.
The key features of Prometheus are:
- Multi-dimensional data collection
- Alerting and visualization (often used with Grafana)
Microsoft Azure Monitor
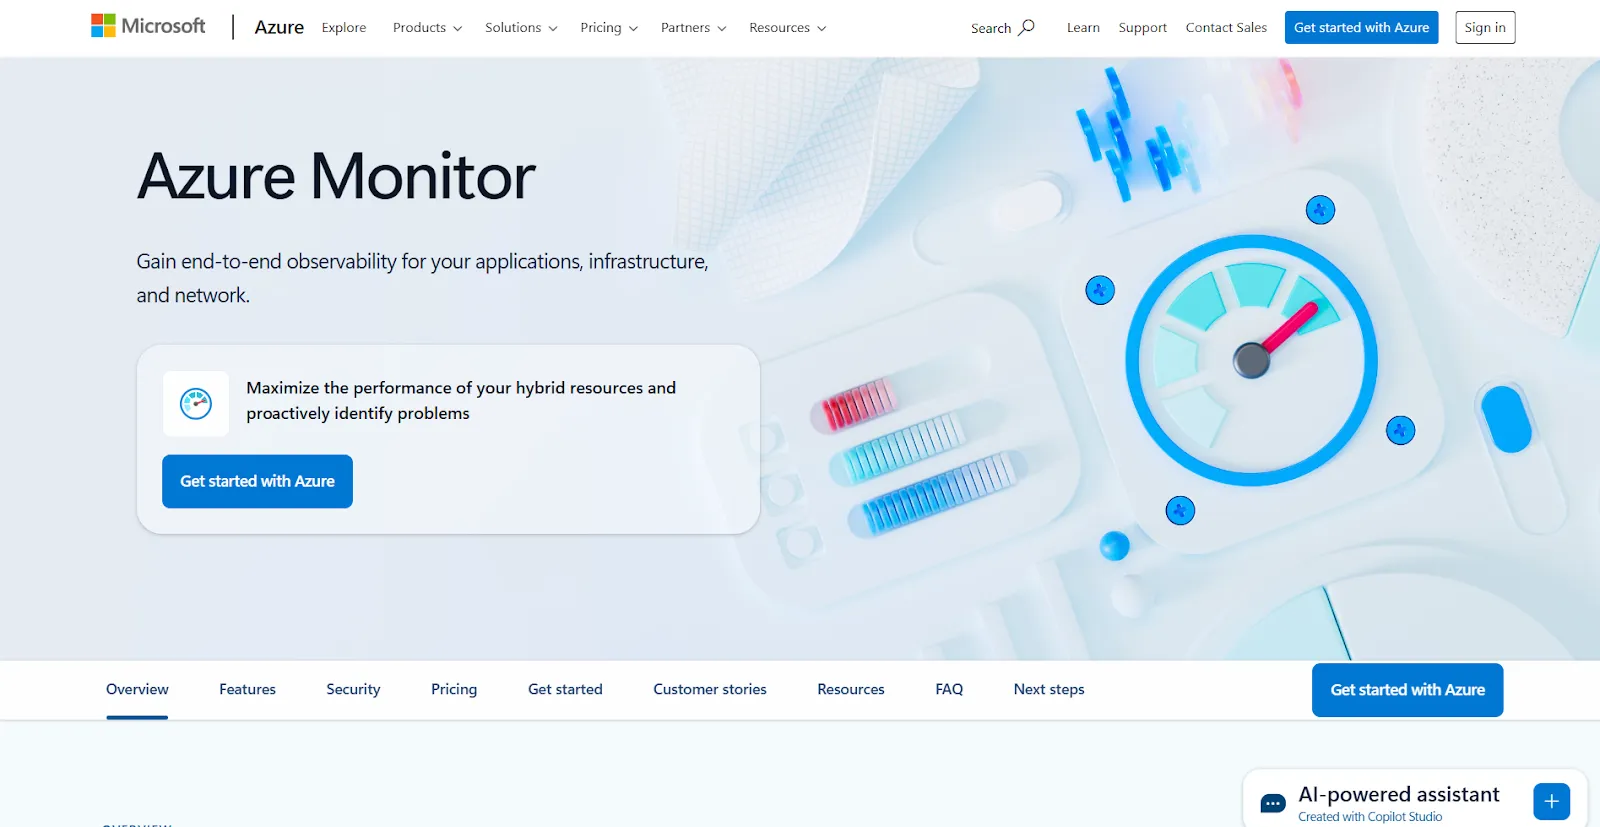
Azure Monitor is Microsoft's cloud-native monitoring solution for Azure resources and applications. It offers comprehensive observability across infrastructure, applications, and networks. Its key features include:
- Real-time metrics and logs
- Application insights and distributed tracing
- Integration with Azure Security Center
Google Cloud Operations
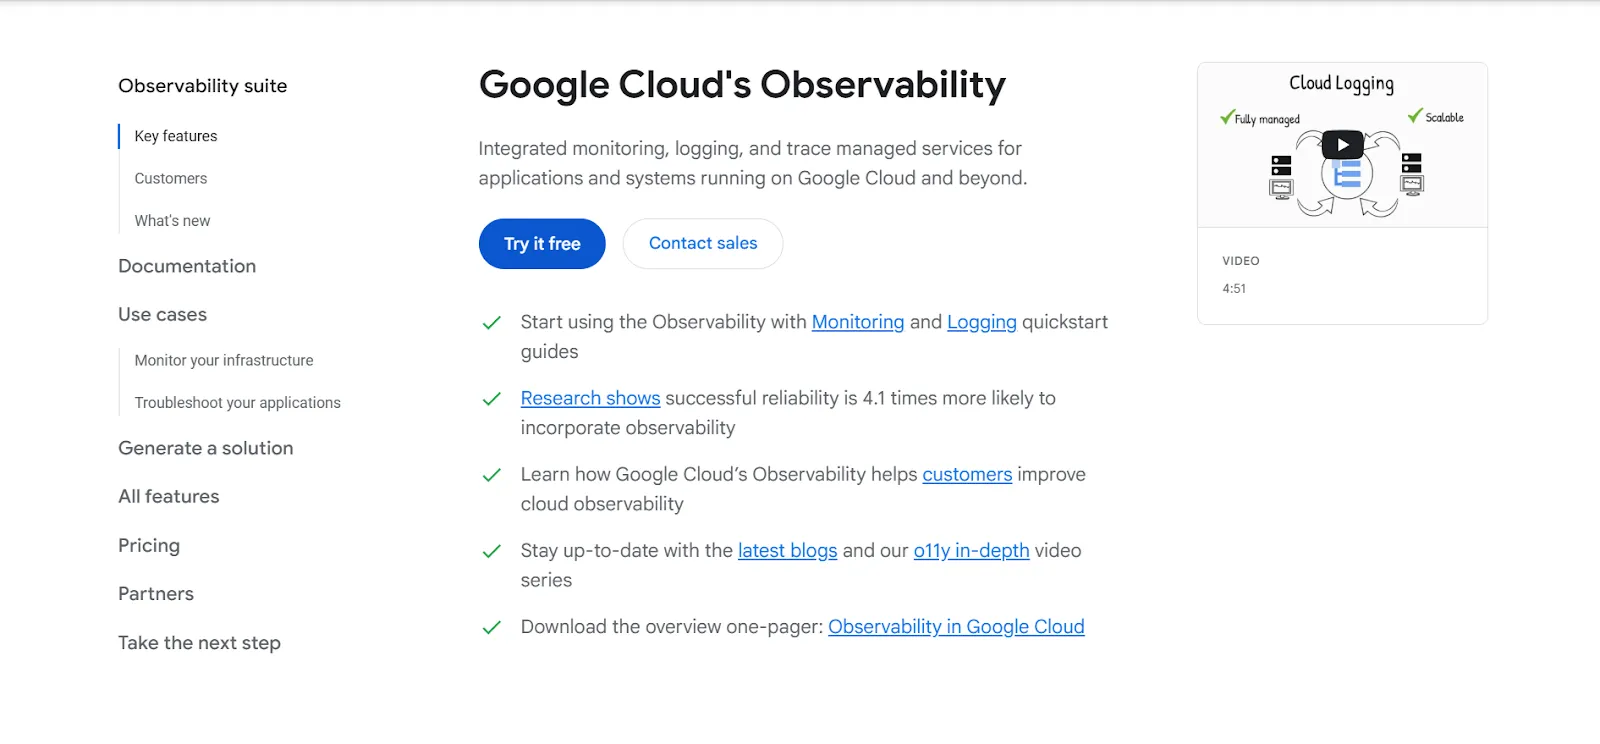
Formerly known as Stackdriver, this is Google Cloud’s native monitoring, logging, and diagnostics platform. It's tightly integrated with Google Cloud and Kubernetes services.
The key features of Google Cloud Operations include the following:
- Real-time monitoring and logging
- Custom dashboards and alerting
- Distributed tracing and incident response
- Integration with Google Cloud and hybrid environments
Amazon CloudWatch
This AWS monitoring service is used to collect and analyze log data and metrics to gain visibility and actionable insights for AWS resources and applications. Amazon CloudWatch can be integrated with over 70 AWS services and used with CloudWatch Events to set off automated workflows and actions.
These monitoring and observability services have the following key features:
- Automated alarms and dashboards
- Integration with AWS Lambda, EKS, and ECS
- Metrics, logs, and event monitoring
Riemann
This open-source monitoring tool is designed for event stream processing and real-time monitoring of distributed systems. Riemann is easily integrated with Graphite and the Sinatra app interface, used for data visualization or system overviews.
Some of Reimann's key features include:
- Integration with various data sources and visualization tools
- Customizable alerting and notifications
Datadog
Datadog is a cloud-based monitoring and analytics platform that offers full-stack observability for cloud-native environments. It's a SaaS-based platform offering alerts, metrics, and visualization with the following key features:
- Distributed tracing and APM
- Integration with cloud providers and orchestration platforms
- Real-time dashboards and custom alerts
New Relic
This is one of the third-party cloud monitoring tools designed to help engineers plan, deploy, and build. New Relic provides end-to-end observability for applications and infrastructure, with a focus on performance monitoring and analytics. Its powerful analysis tools help accelerate troubleshooting processes and quickly identify issues.
New Relic's key features:
- Unified telemetry (metrics, logs, traces)
- AI-powered anomaly detection and alerting
- Application performance monitoring (APM)
Grafana
This open-source analytics and visualization platform is commonly used in conjunction with Prometheus and other data sources to create real-time dashboards. Some of Grafana's key features include the following:
- Extensible plugin systems
- Customizable and interactive dashboards
- Alerting and reporting features
- Support for multiple data sources (Prometheus, Azure, AWS, etc.)
Assessing a Cloud Monitoring Tool for Businesses
Businesses recognize that selecting the right cloud-native monitoring tools can make a significant difference. It's important to choose one that meets the business needs, offers just the right features, and aligns with the business's cloud monitoring strategy. To do this, businesses are required to evaluate several key factors:
- Automation: Businesses should consider features for automated Alerting, diagnosis, and remediation.
- Security and Compliance: Always verify that features support monitoring for security threats and regulatory compliance.
- Integration: Ensure compatibility with the business's cloud providers and orchestration platforms.
- Scalability: Select tools that can handle rapid changes in infrastructure and workload demands.
- Cost Management: Assess the ability to track and optimize resource usage to control expenses.
- Data Coverage: Businesses should look for tools that collect and correlate metrics, logs, and traces for comprehensive observability.
To Sum Up
Cloud native monitoring tools are essential for monitoring the complexity and scale of modern cloud environments. They provide the visibility, automation, and resource optimization required to maintain reliable and efficient operations in cloud-native environments.
This is an integral part of business operations, allowing them access to valuable insights into the application performance. Businesses use monitoring to make sure that their overall system is synchronized with the business goals. Investing in the right tools, such as Microtica, enables teams to manage their infrastructure and deliver high-quality digital experiences proactively.

Relevant Posts

.webp)
